The Diagnostics screen: every function explained
Diagnostics is the screen where Spark Speed shows how healthy your site is and why something is slow, without SSH or extra plugins. This page walks through all eight tabs, from Overview to Report, and explains for each card what every check, measurement and button does. Written for WordPress administrators; technical terms are briefly explained along the way.
In short
- Almost everything on Diagnostics is read-only: Spark measures and judges, you decide what to do with it.
- Green is fine, yellow is a warning, red is critical and grey means not measured yet.
- The decisions of Optimize my site are not shown in the admin screens, but they are in the diagnostic report.
- The safety net never switches anything off by itself: a page that reports itself broken always waits for your confirmation.
Diagnostics > Overview
The start screen of Diagnostics. Spark Speed judges the most important parts itself and shows a green check or a warning for every check on each card. There is nothing to set: everything is measured again when you open the tab.
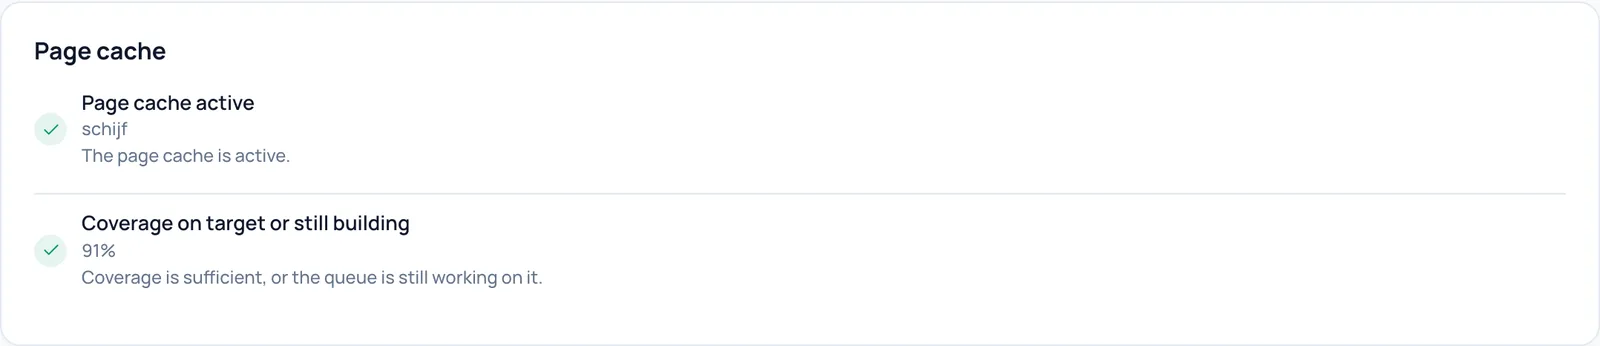
Page cache: Page cache active and Coverage on target or still building
- What it does
- Page cache active shows whether visitors receive ready-made (cached) pages and how, for example schijf (disk). If the page cache is off, this row turns red. Coverage on target or still building compares the share of pages already in the cache with 90 percent. If coverage drops below that while the queue is empty, you get a warning: nothing is building the cache any further.
- How to check the effect
- A green check means fine, yellow is a warning, red is critical and grey means nothing could be measured (yet). The percentage next to coverage is the measured share of cached pages.
- Example
- On the test site coverage showed 91%: above 90 percent, so green.
- How to undo
- Nothing to undo: this is only a verdict. If coverage is low, rebuild the cache with the button in the Spark Speed header.

Object cache: Object cache connected
- What it does
- An object cache keeps the results of database queries in memory or in a fast file, so WordPress does not have to ask them again every time. This check only appears when the Spark object cache is active and reports whether it is really connected to the storage behind it (the backend, for example sqlite or Redis). Without a connection the row turns red: the site then keeps running without an object cache.
- How to check the effect
- Green with the backend name means connected. Red means the drop-in is installed but could not connect.
- Example
- After the first optimization run on the test site this showed sqlite with a green check.
- How to undo
- Nothing to undo. If red: check whether the backend (for example the Redis server) is reachable.
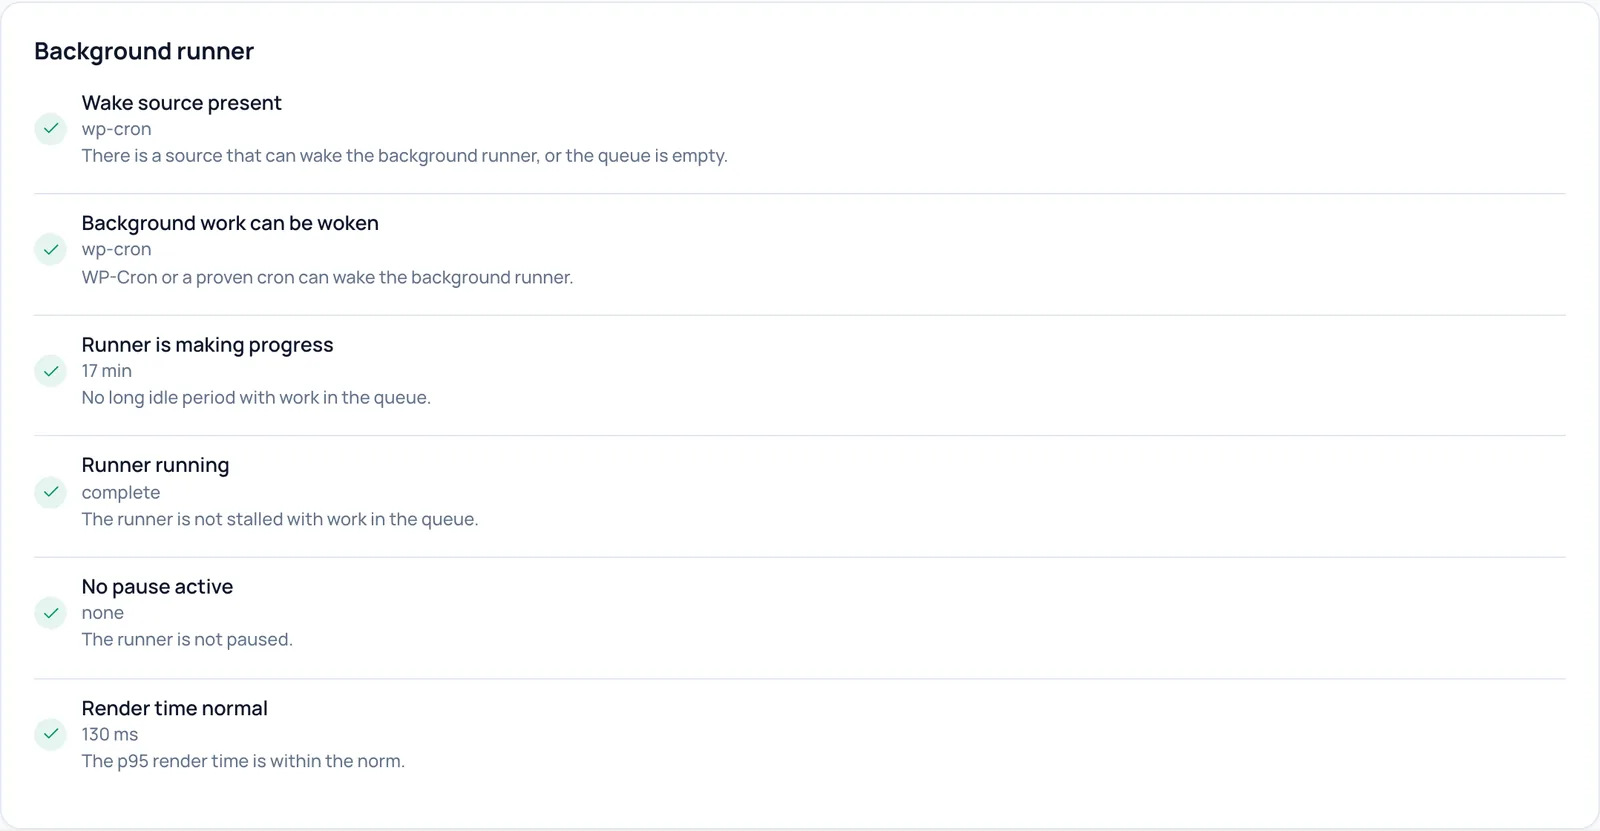
Background runner: six checks
- What it does
- The background runner is the part of Spark that puts pages into the cache in the background (warming). This card checks that it runs well:
- Wake source present: something can start the runner (a wake source, such as WP-Cron), or the queue is empty. If work is waiting without a wake source and without progress in the last half hour, this turns red.
- Background work can be woken: WP-Cron or a proven system cron can wake the runner.
- Runner is making progress: no long silence while work is queued. The number is the time since the last progress.
- Runner running: the runner has not stalled. A deliberate pause does not count as stalled.
- No pause active: the runner is not paused. A pause can be caused by slow pages or a site in maintenance mode, for example.
- Render time normal: the p95 render time (95 percent of pages are built within this time) stays within the norm. Above 5 seconds it turns yellow, above 15 seconds red, and then the button Create render profile appears.
- How to check the effect
- Each row has its own colour. More detail, such as the last cron run and the pause counter, is on Diagnostics > Cache.
- Example
- If the queue stood still for a night because nobody visited the site, Runner is making progress reports that the runner was idle for a long time.
- Watch out
- Spark wakes itself when there are visitors. A system cron that calls wp-cron.php regularly is an optional extra safeguard, especially when WP-Cron is disabled.
- How to undo
- Nothing to undo: these are verdicts. Fix the cause, or let a pause run out by itself.
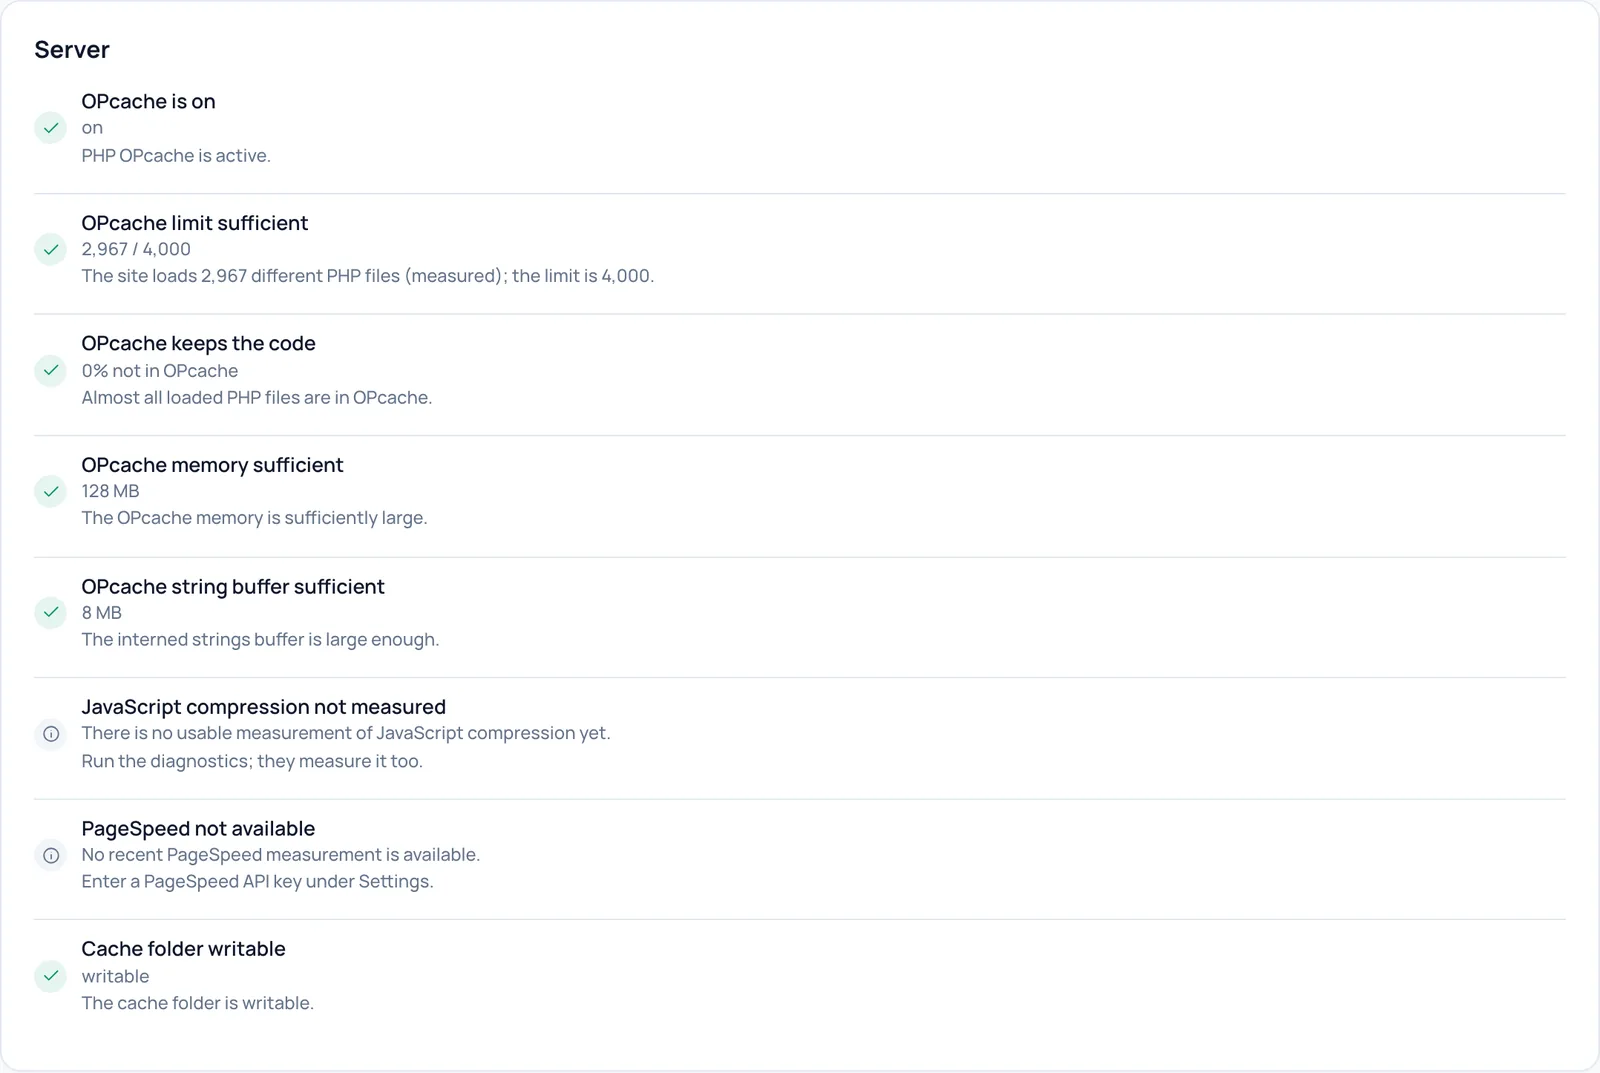
Server: eight checks
- What it does
- OPcache is the memory in which PHP keeps the already compiled code of WordPress and your plugins. If the site does not fit, PHP has to compile that code again on every request, and uncached pages and the admin become slow. The card checks:
- OPcache is on: PHP OPcache is active.
- OPcache limit sufficient: the number of PHP files the site really loads (measured) against the maximum OPcache may keep.
- OPcache keeps the code: which share of the loaded files is not in OPcache. Close to zero is good.
- OPcache memory sufficient and OPcache string buffer sufficient: enough memory for the code and for shared strings.
- JavaScript compression not measured: whether the server sends JavaScript compressed. This measurement comes from the diagnostic report; until that has run, the row stays grey.
- PageSpeed not available: there is no recent PageSpeed measurement yet.
- Cache folder writable: Spark can write files to the cache folder. Without write access the page cache cannot work.
- How to check the effect
- Under a yellow or grey row you see advice, for example Run the diagnostics; they measure it too. or Enter a PageSpeed API key under Settings. For an OPcache shortage the exact php.ini lines are on Diagnostics > Server.
- Example
- On the test site: 2,938 / 4,000 for the OPcache limit, so the site fits easily.
- Watch out
- Spark cannot enlarge OPcache itself. You change it in php.ini or ask your hosting provider.
- How to undo
- Nothing to undo: these are verdicts.
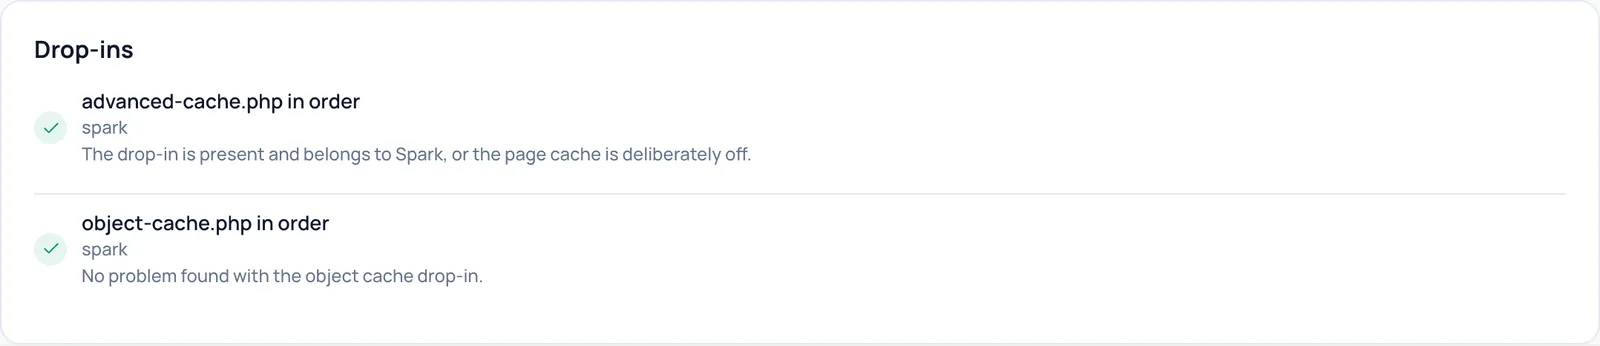
Drop-ins: advanced-cache.php and object-cache.php
- What it does
- A drop-in is a special file in the wp-content folder that WordPress loads very early; cache plugins use it to serve pages before the rest of WordPress starts. advanced-cache.php in order turns red when the page cache is on but the file is missing or belongs to another plugin. object-cache.php in order warns about an outdated Spark file or a file from another plugin.
- How to check the effect
- Green with spark means the file belongs to Spark.
- Example
- If a second cache plugin is still active, it may have placed its own advanced-cache.php. This row then turns red.
- Watch out
- Do not run two page caches at the same time.
- How to undo
- Nothing to undo. With a red row: deactivate the other cache plugin.
Diagnostics > Cache
This tab shows why pages do or do not end up in the cache and how warming is going. Everything on this tab is read-only.

What lowers the hit ratio
- What it does
- The hit ratio is the share of visitors who get a page from the cache. At the top Spark looks for settings or plugins that are known to lower that share, such as WooCommerce geolocation with page cache support, plugins that switch per country or currency, a tracking cookie (for example _ga) in the list of cookies that skip the cache, or the lack of a separate mobile cache. Below that is Why pages did not get cached (7 days, estimated): the most common reasons why Spark refused to store a page.
- How to check the effect
- A red icon is a major cause, yellow a medium one. No cache keys found that ruin the hit ratio. means nothing was found. The counts are estimates: Spark counts one in ten refused pages from anonymous visitors, which is why they start with a tilde (~).
- Example
- On the test site DONOTCACHEPAGE set by another plugin showed ~20: another plugin asked not to cache those pages.
- How to undo
- Nothing to undo: this is an overview. Change the named setting or plugin if needed.
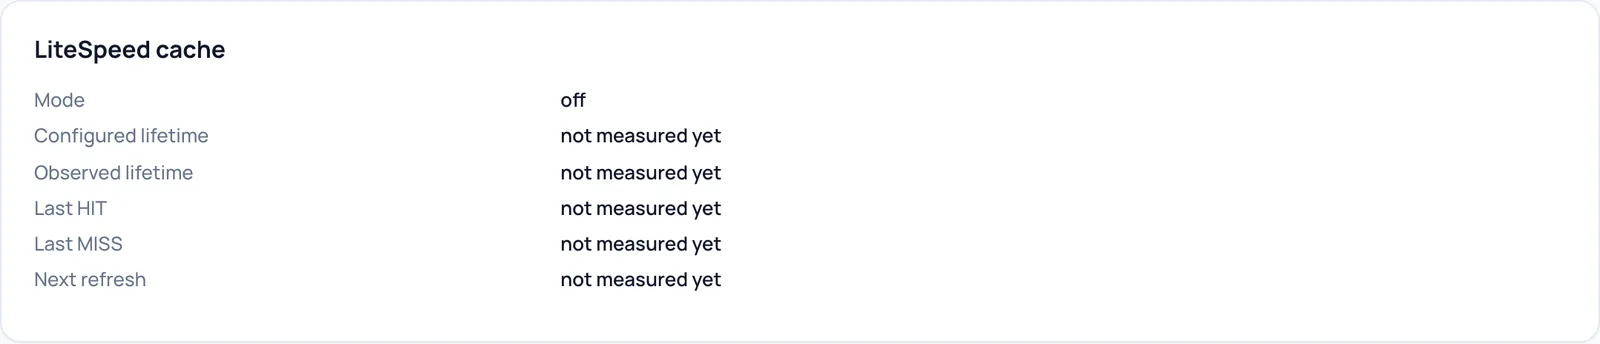
LiteSpeed cache
- What it does
- Shows whether the cache of a LiteSpeed web server works and how long it keeps pages: Mode, Configured lifetime, Observed lifetime, Last HIT (last time served from the cache), Last MISS (last time not from the cache) and Next refresh.
- Requirements
- Only filled on a LiteSpeed server. On other servers it shows not measured yet, as on the Apache test site.
- How to undo
- Nothing to undo: read-only.

Background runner and cron
- What it does
- The raw data behind the runner checks on the Overview: Status, Wake source (what starts the runner), Last cron, Paused until, Pause counter and Slow streak (how many slow pages in a row).
- How to check the effect
- complete as status means the queue is done. no pause means the runner is free to work.
- Example
- If the last cron was hours ago while work is queued, the site is not being woken. Check the Overview checks in that case.
- How to undo
- Nothing to undo: read-only.

Warm-up times
- What it does
- How long building a page without cache takes during warming: Median (the middle value) and p95 (95 percent is faster than this), in milliseconds.
- How to check the effect
- Above 5 seconds p95, Render time normal on the Overview turns yellow, above 15 seconds red.
- Example
- Test site: median 123 ms, p95 135 ms.
- How to undo
- Nothing to undo: read-only. If the times are high, create a render profile.
Diagnostics > Redis
For sites that use Redis as object cache. Without Redis this shows not measured yet, as on the test site.

Redis
- What it does
- Redis is a fast in-memory database that can serve as object cache. This card shows the health of the Redis server without a command line, such as used memory, peak memory, the memory limit, the eviction policy (what Redis throws away when it gets full), the number of keys, the Redis version and a sample of keys with and without an expiry time (TTL).
- Requirements
- The Spark object cache must be active with Redis as the backend.
- How to undo
- Nothing to undo: read-only.

Breaker, garbage collector and flushes
- What it does
- Breaker is a safety switch: after errors on the Redis connection the object cache can switch itself off for a while so the site keeps working. open: no means that safety switch has not tripped. Garbage collector (gc) shows whether clean-up of old keys runs, Flushes how often the object cache was emptied.
- How to check the effect
- Values are shown as short "name: value" text. Without measurements it shows not measured yet.
- How to undo
- Nothing to undo: read-only.
Diagnostics > Server
Everything about the server the site runs on: OPcache, frugal mode, the front-end load plan, raw server measurements and which cache layer is in charge.
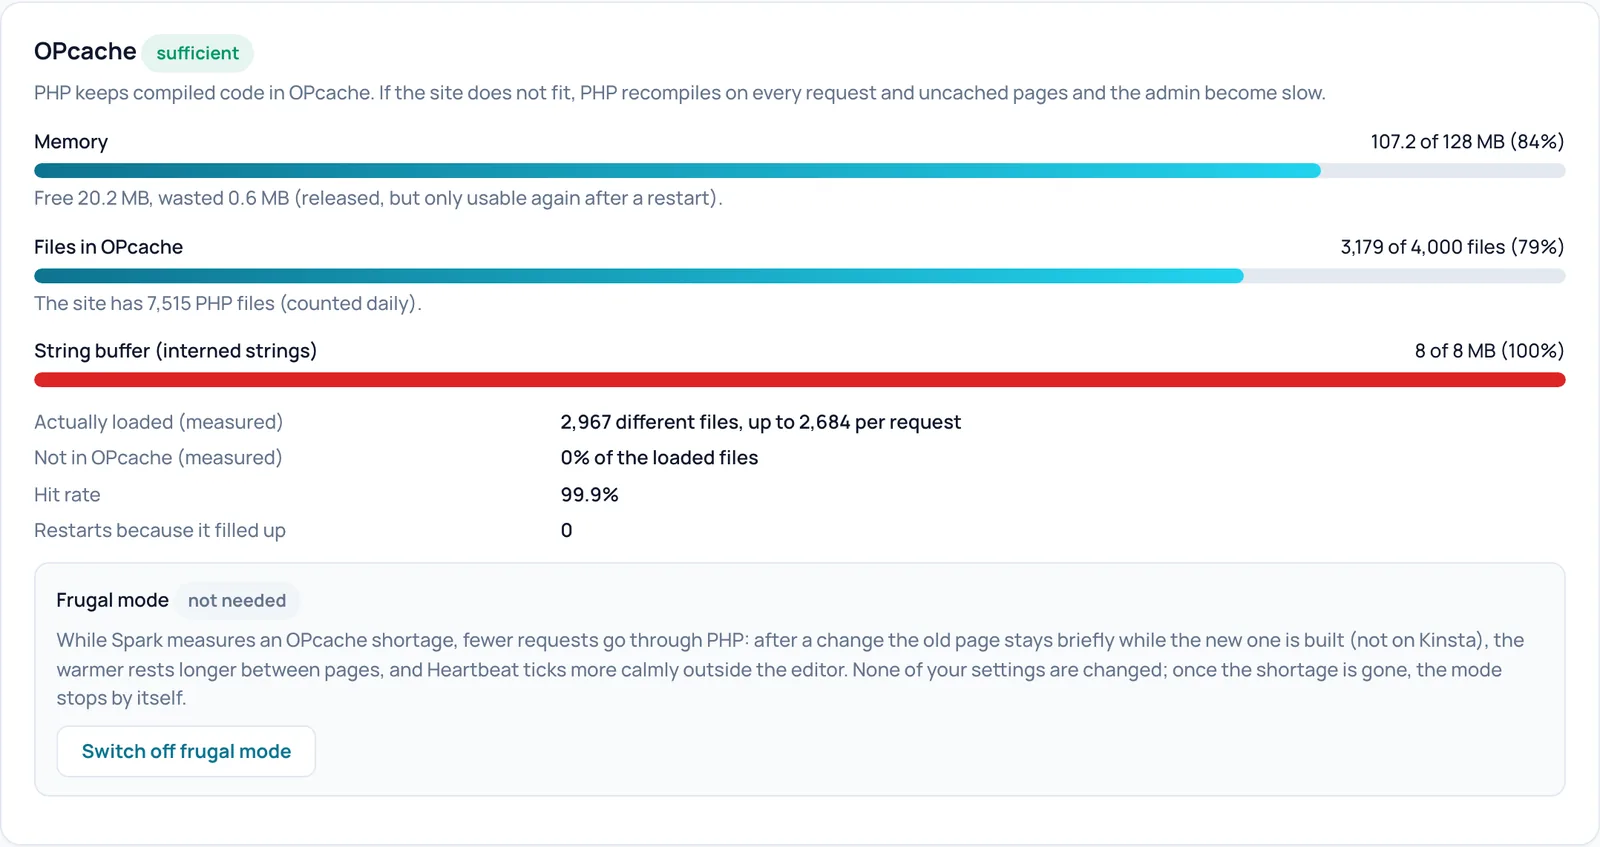
OPcache sufficient
- What it does
- The label in the title (for example sufficient) gives the verdict. Below it: Memory, Files in OPcache and String buffer (interned strings) as a bar with a percentage, and the rows Actually loaded (measured), Not in OPcache (measured), Hit rate (how often code came straight from OPcache) and Restarts because it filled up.
- How to check the effect
- If OPcache is not sufficient, a yellow advice box appears with the three php.ini lines you can copy. Spark then also shows a notice on the WordPress dashboard, which you can hide for 14 days.
- Example
- Test site: 3,169 of 4,000 files (79%) and a hit rate of 99.9%.
- Watch out
- A string buffer at 100 percent is not an error in itself as long as the verdict stays sufficient. Spark cannot change OPcache itself: you do that in php.ini or through your hosting provider.
- How to undo
- Nothing to undo: read-only.
Switch off frugal mode
- What it does
- Frugal mode relieves a server whose OPcache is too small. While Spark measures a shortage, fewer requests go through PHP: after a change the old page stays briefly while the new one is built (not on Kinsta), the warmer rests longer between pages, and Heartbeat ticks more calmly outside the editor. Your saved settings do not change; once the shortage is gone, the mode stops by itself. This button switches the mode off completely.
- When to switch it on or off
- Normally leave it on automatic. Only switch it off if visitors must never briefly see the old page after a change and the server can handle the extra load.
- Requirements
- The mode only switches on when Spark has actually measured an OPcache shortage. The label (for example Frugal mode not needed) shows the current state.
- Watch out
- While the mode is active, a visitor may briefly see the previous version after an edit, and warming is slower.
- How to undo
- Click the same button, which is then called Let it switch on automatically.
- Technical name
zuinig_modus
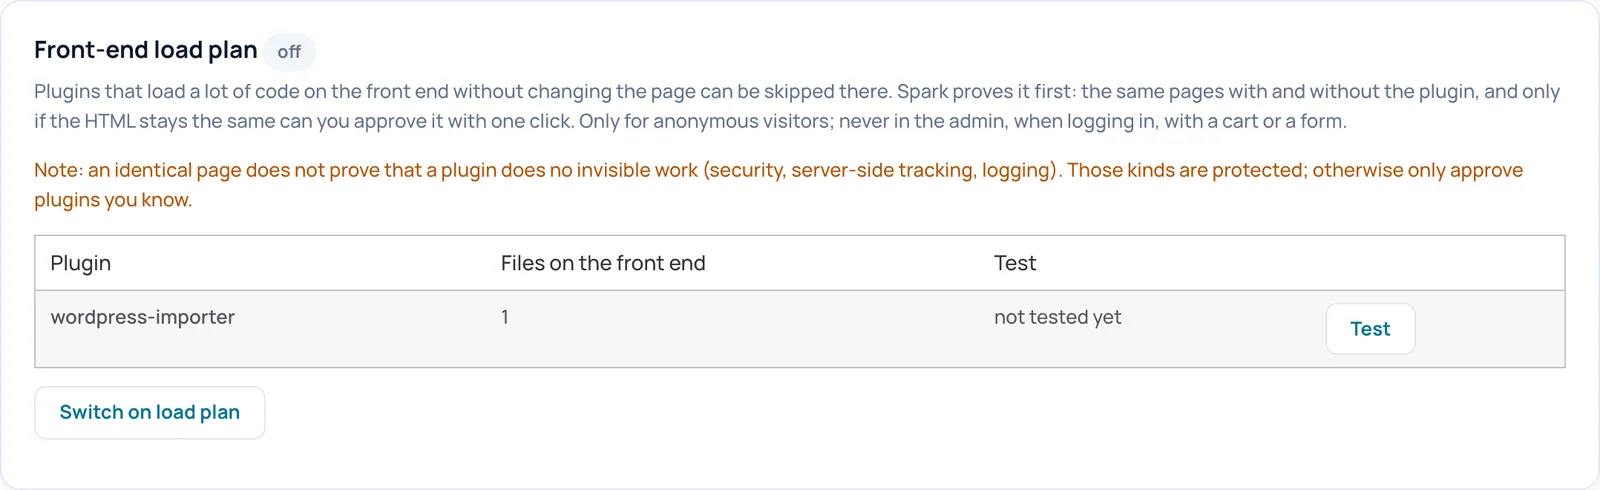
Test (per plugin)
- What it does
- The table shows plugins that load code on the front end, with the number of files and the result of the test. Test makes Spark build the same pages with and without that plugin and compare the HTML. The result is page identical, page changes or undecided, with the difference expandable. With an identical page the button Skip appears; with a changed page Skip anyway, which asks for confirmation first.
- When to switch it on or off
- Use it when uncached pages are slow and a plugin loads many files that add nothing on the front end.
- Requirements
- Spark first has to measure which plugins the front end loads. That happens automatically on uncached visits and during warming; until then the card says there are no candidates yet. Plugins for security, backups, page builders, tracking, cookie consent, WooCommerce and Spark itself, among others, are protected and do not appear here.
- How to check the effect
- A skipped plugin gets the label skipped in the table.
- Example
- On the test site only wordpress-importer was listed, with 1 file: a plugin you do not need on the front end.
- Watch out
- An identical page does not prove that a plugin does no invisible work, such as security, server-side tracking or logging. Only approve plugins you know.
- How to undo
- Click Load again for that plugin.
Switch on load plan
- What it does
- Switches the whole load plan on or off. Only with the load plan on are approved plugins really skipped, and then only for anonymous visitors on the front end: never in the admin, when logging in, with a cart or a form.
- When to switch it on or off
- Switch it on after you have tested and approved at least one plugin.
- How to check the effect
- The label next to the title changes from off to on and the button then reads Switch off load plan.
- How to undo
- Click Switch off load plan.
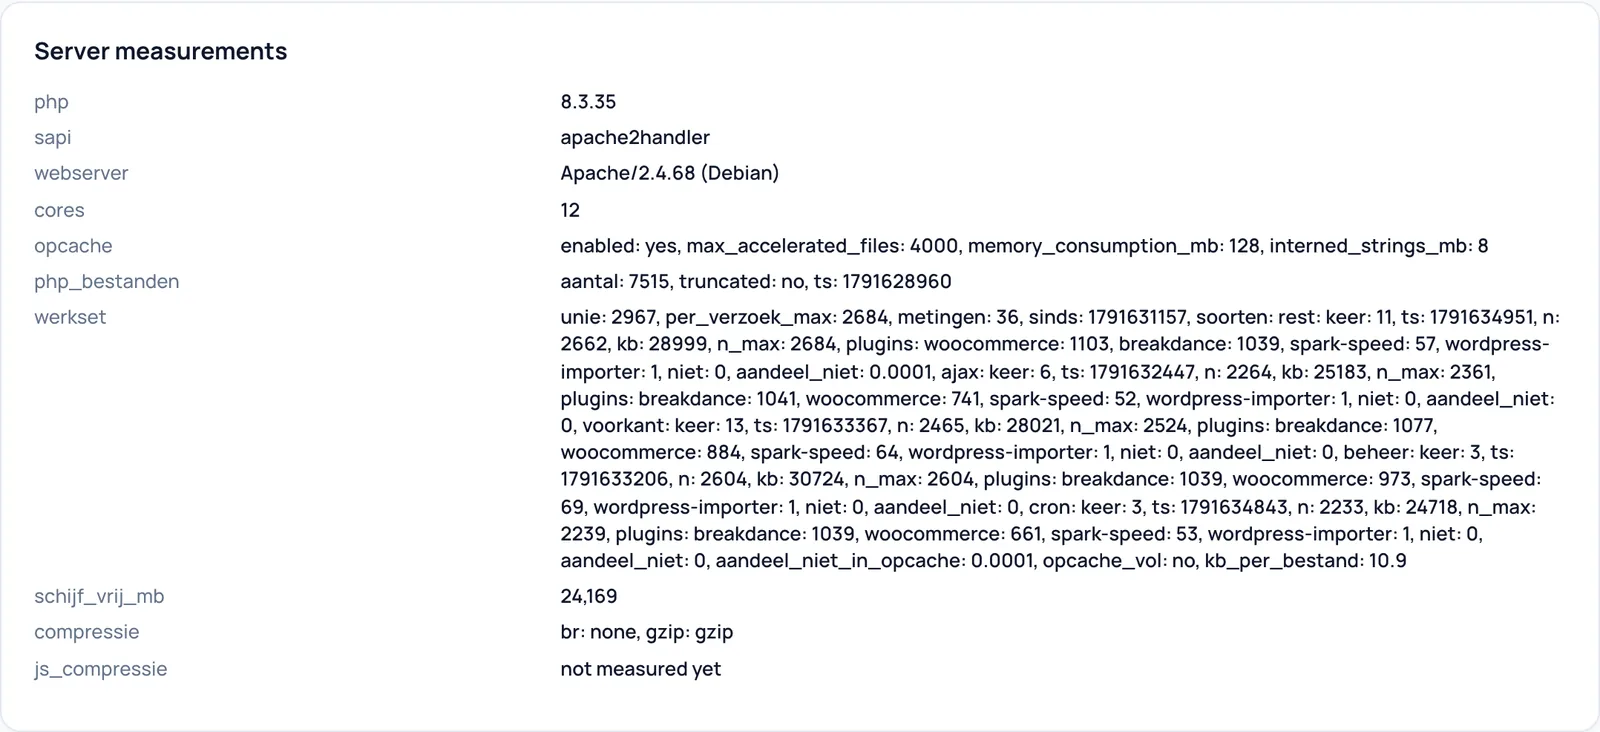
Server measurements
- What it does
- The raw measurements, with their internal names: PHP version, how PHP runs (sapi), web server, number of CPU cores, the OPcache settings, the number of PHP files, the working set (which files are really loaded per type of request, also per plugin), free disk space and compression.
- How to check the effect
- Mainly useful for support. Missing values show not measured yet.
- Example
- In the working set of the test site WooCommerce and Breakdance each loaded over a thousand files per request.
- How to undo
- Nothing to undo: read-only.

Server
- What it does
- Tiles with what Spark detected about the server: Detected stack (web server, cores, object cache), Page cache (the Spark drop-in, or via LiteSpeed), Object cache and Apache static-serve. With static-serve Apache delivers cached pages through .htaccess without starting PHP.
- How to check the effect
- This tells you whether only one page cache is in charge. Note: pages Apache serves statically carry no x-spark-speed headers; only a page that did not come from the cache has x-spark-speed-cache: MISS.
- Example
- Test site: Apache · 12 cores · object cache on and Active · SQLITE connected.
- How to undo
- Nothing to undo: read-only.
Diagnostics > Render profile
Find out which plugin, template or database query makes an uncached page slow. Spark measures a single request; visitors notice nothing and the result never enters the cache.

Page
- What it does
- The address of the page you want to measure. It must be a page on this site.
- Example
- Enter the address of a slow product page.
- Watch out
- A page that redirects only measures the redirect. Enter the final address instead.
Profile without cache
- What it does
- Spark requests the page once as an anonymous visitor, without cache, and measures where the time goes: per WordPress step, per plugin (loading, hooks and template), per database query and per external request. OPcache, object cache and memory are included too. The result appears as plain-language conclusions, a timeline and tables per plugin, slowest hooks, database and external requests. The last five profiles are kept.
- When to switch it on or off
- When warm-up times are high, when Render time normal is yellow or red, or when a particular page feels slow without cache.
- Requirements
- The site must be able to reach itself (loopback). A cache or firewall in front of the site that ignores the measuring parameter produces no profile; you then get an error message with an explanation.
- How to check the effect
- Afterwards you see Render profile ready with the path and duration. Measuring takes about as long as the page itself. Until there is a profile, it says: No profile yet. Choose a page and click Profile without cache; it takes about as long as the page itself.
- Example
- A conclusion may be that one plugin accounts for most of the render time.
- Watch out
- Database queries are only measured if SAVEQUERIES is not set to false in wp-config.php. Without the Spark drop-in (for example with LiteSpeed cache) plugins that load before Spark are not measured separately.
- How to undo
- Nothing to undo: a profile is only a measurement.

Diagnostics > Optimization
Speed data (lab and real visitors) and the AI route: download a file for Claude and import the configuration Claude returns.

What keeps the score from green
- What it does
- Uses a stored measurement per device (mobile and desktop) to work out which parts of the Lighthouse score cost the most points and which Spark settings can help. Field data from real Chrome users (CrUX) is shown too when available.
- Requirements
- At least one stored measurement: a PageSpeed run or an uploaded Lighthouse JSON. Otherwise it says No measurement yet.
- Watch out
- The points are an expectation based on the score curves, not a promise.
- How to undo
- Nothing to undo: read-only.

Field measurement (RUM lite)
- What it does
- RUM stands for real user monitoring: measuring with real visitors. The card shows the p75 (75 percent of visitors get it at least this fast) of the last 28 days per device, the slowest pages and the scripts that were busy during the slowest interaction.
- Requirements
- Field measurement must be switched on; that switch is on the Optimization tab. After that, data comes in as visitors view pages.
- How to check the effect
- Green is good, orange needs improvement, red is poor (thresholds per web.dev).
- Watch out
- According to the card: no cookies, no personal data, only the path of the page, with a sample of 10 percent of page views.
- How to undo
- Switch field measurement off again on the Optimization tab.
- Technical name
rum
Configure
- What it does
- Link to the place on the Optimization tab where you switch on field measurement.
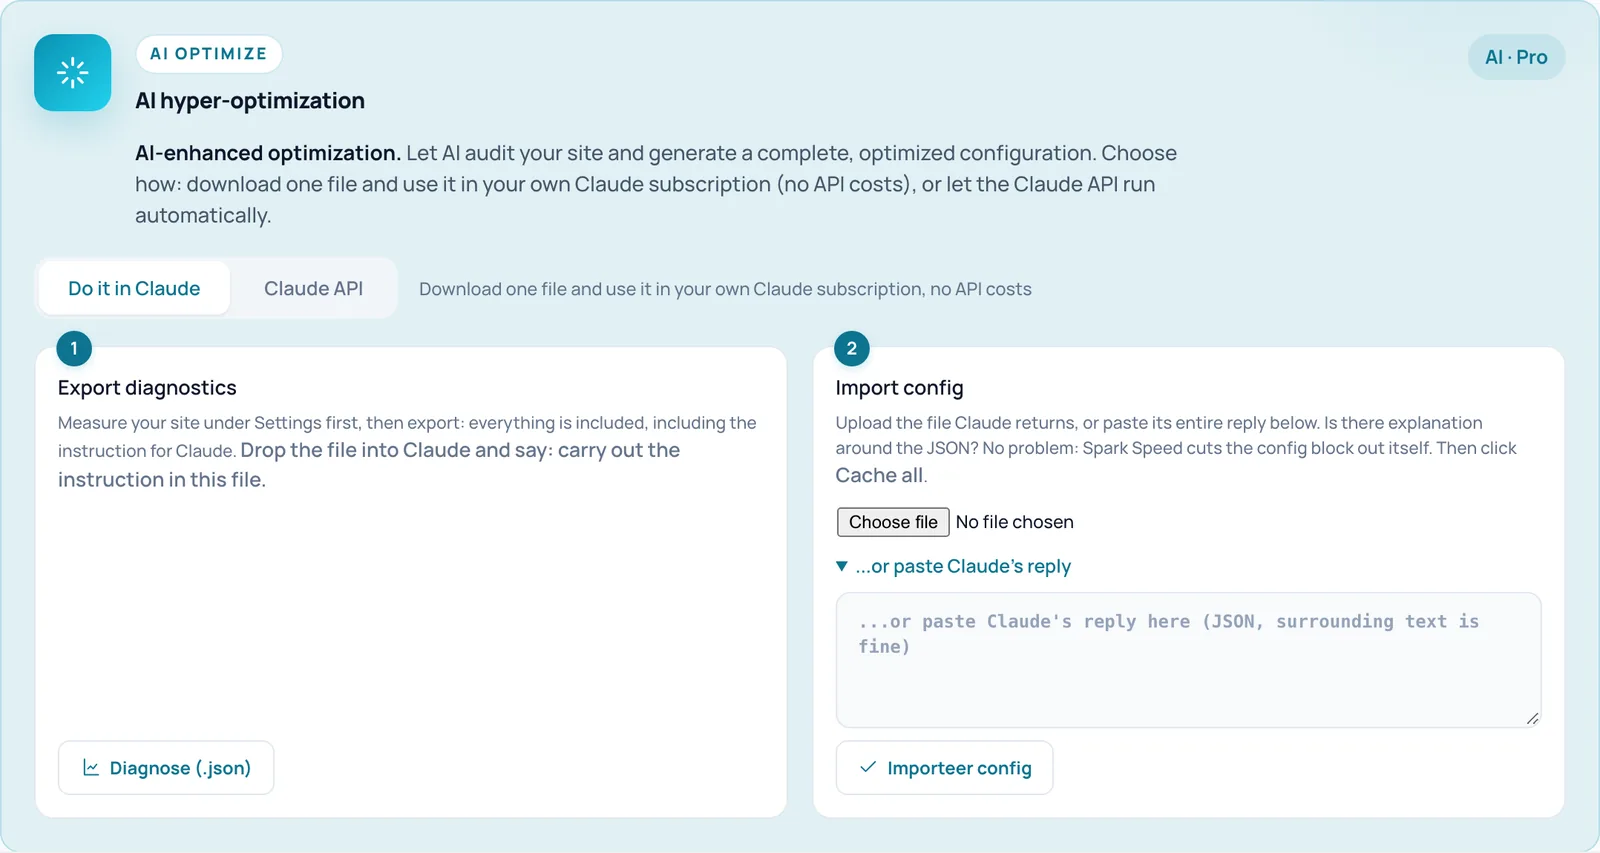
Do it in Claude
- What it does
- The route without API costs: you download a file, use it in your own Claude subscription and import the configuration Claude returns. The card then shows two steps: Export diagnostics and Import config.
- Requirements
- A valid licence (or the 14-day grace period) and your own Claude subscription.
- How to undo
- Choose Claude API to switch routes.
Claude API
- What it does
- The automatic route: Spark calls the Claude API itself with your own Anthropic API key and stages the result as a proposal. Nothing is applied until you approve the proposal yourself.
- Requirements
- A valid licence and an Anthropic API key, which you save under Settings > Claude API.
- Watch out
- API calls cost credit with Anthropic. Your site's diagnostic data is sent to Anthropic.
- How to undo
- Choose Do it in Claude.
Diagnose (.json)
- What it does
- Downloads the same diagnostic report as on the Report tab, with the instruction for Claude at the top. Drop the file into Claude and say: carry out the instruction in this file.
- Requirements
- A valid licence. Preferably measure your site first, so the file contains scores.
- Watch out
- The file contains no passwords or keys, but it does contain file paths, plugins with versions, your Spark settings and addresses of your site. You decide where to send it.
Choose file and ...or paste Claude's reply
- What it does
- Two ways to supply Claude's answer: upload the JSON file Claude returns, or expand ...or paste Claude's reply and paste the entire answer. If there is explanation around the JSON, Spark Speed cuts out the configuration block itself.
Importeer config
- What it does
- Merges Claude's configuration with your current settings: only the settings in the file are overwritten and lists are added to. The cache is then refreshed.
- Requirements
- A valid licence.
- How to check the effect
- A notice appears at the top. If the import switches on risky settings, the notice lists them and asks you to check the site. Settings an import is not allowed to set are ignored and listed.
- Watch out
- A configuration made for another site is refused. There is no automatic undo button for an import.
- How to undo
- Before importing, export your current settings with Export .json on the Report tab, and if anything goes wrong import that file with Replace.
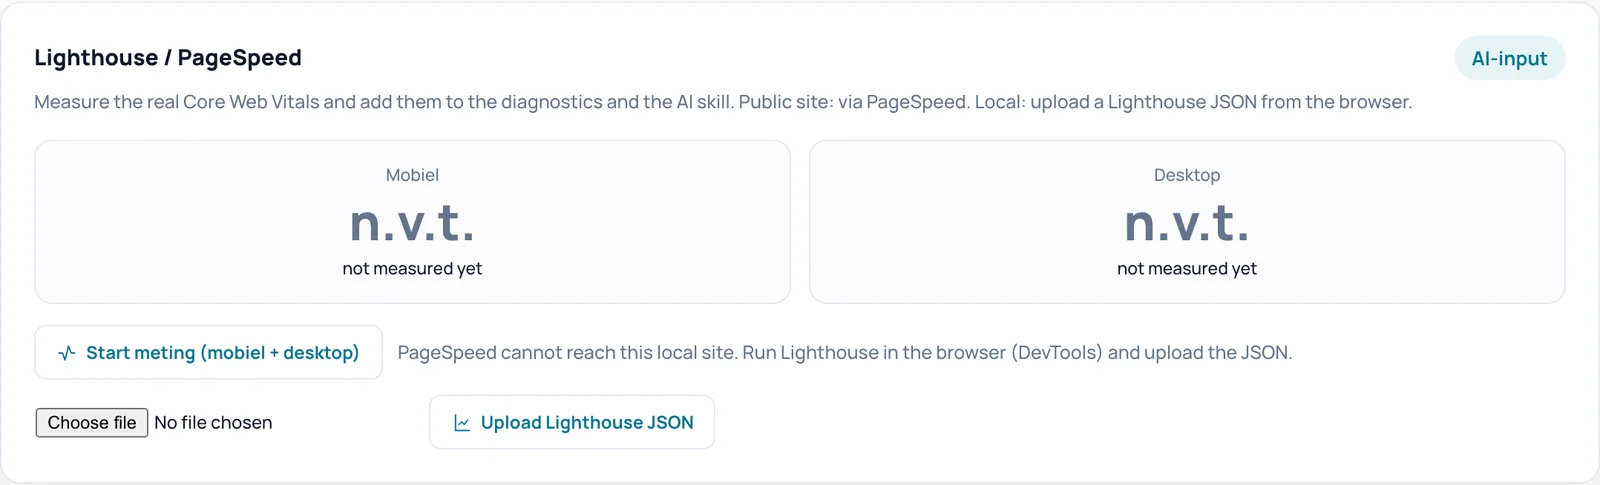
Mobiel and Desktop
- What it does
- Score tiles with the latest measured score, LCP (how fast the largest visible element appears) and TBT (how long the page is blocked), plus the age and source of the measurement. With several measurements a chart with the score history and a list of the biggest bottlenecks appear too.
- How to check the effect
- Without a measurement it shows n.v.t. and not measured yet.
- How to undo
- Nothing to undo: read-only.
Start meting (mobiel + desktop)
- What it does
- Has Google PageSpeed measure the home page, mobile and desktop. The results go into the score tiles, the diagnostic report and the AI route.
- Requirements
- A valid licence, a PageSpeed API key (Settings > Measurement settings) and a publicly reachable site.
- How to check the effect
- Usually the measurement runs in the background and you see Measurement started (mobile + desktop). The results will appear here automatically. The page then refreshes itself.
- Watch out
- PageSpeed cannot reach a local site; use Upload Lighthouse JSON instead. Each measurement sends the page address and your key to Google.
Upload Lighthouse JSON
- What it does
- Imports a Lighthouse report you saved as JSON in Chrome DevTools (max 8 MB). Works without an API key and also for local sites.
- Requirements
- A valid licence.
- Example
- Open the home page in Chrome, run Lighthouse in DevTools, save the report as JSON and upload it here.
Diagnostics > Log
The safety net for pages that report themselves broken, and the latest cache activity.

Catch breakage reports
- What it does
- Spark places a small watcher in optimized pages. It only reports a page when it throws a script error shortly after loading, the visitor has not touched anything yet and the page appears collapsed. After reports from six different visitors, the page appears on this tab with a button to turn optimization off for it in one click. The page is then served unoptimized, but still cached.
- When to switch it on or off
- Leave it on. Only switch it off if you do not want a watcher in your pages.
- Requirements
- Works on optimized pages; logged-in users get no optimization and therefore no watcher.
- How to check the effect
- The page source of an optimized page contains a script with the id spark-sentinel.
- Watch out
- Deliberately not automatic: a fabricated report can never disable your optimization on its own. You always confirm. This setting cannot be changed through an import or an AI proposal. You can confirm at most five rollbacks per day.
- How to undo
- Flip the switch and click Save settings. A confirmed rollback is undone with Clear & re-optimize on the card that then appears.
- Technical name
auto_rollback
Save settings
- What it does
- Saves the state of Catch breakage reports.
- How to check the effect
- A notice appears at the top and the switch keeps its new state.

Latest activity
- What it does
- When the cache was last cleared, last rebuilt and when the last optimization run took place, with the time elapsed since.
- How to check the effect
- If nothing has happened yet, it says No activity measured yet.
- Watch out
- This is not a full log: the individual optimizer decisions and a history of changed settings are not shown here. The optimizer decisions are in the diagnostic report.
- How to undo
- Nothing to undo: read-only.
Diagnostics > Report
Download everything about the site in one file for support or AI, and take your settings to the next site.

Download diagnostic report
- What it does
- Downloads a JSON file with server, PHP, cache, active plugins, measured scores, what the optimizer decided earlier, up to four pages with the scripts and stylesheets that really load, findings about the site and recommendations. The instruction for AI is included, so you can drop the file straight into Claude.
- When to switch it on or off
- For a support request, for the AI route, or to read back the decisions of Optimize my site: they are not in the admin screens, but they are in this report.
- Requirements
- A valid licence. The report fetches pages from the site itself, so it can take up to about 45 seconds.
- How to check the effect
- Your browser downloads a file named spark-speed-report followed by the domain name and the date. After the report, the JavaScript compression check on the Overview can show a result too.
- Watch out
- No passwords or keys, but it does contain file paths, plugins and versions, your theme, your Spark settings and addresses of your site. You decide who you share it with.
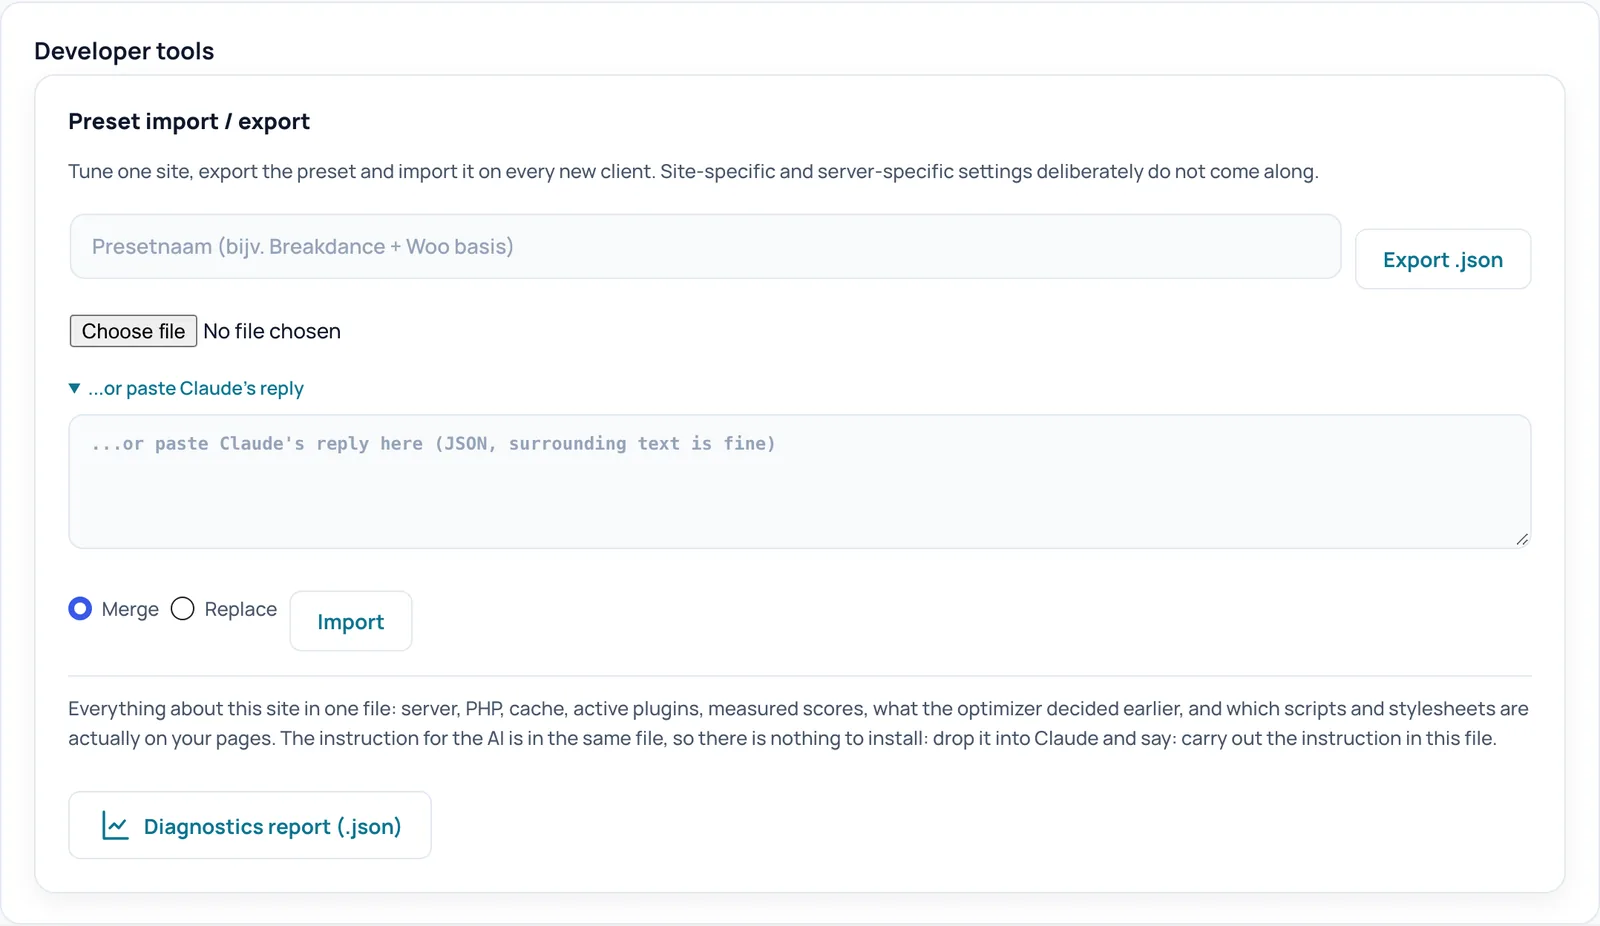
Preset name
- What it does
- Optional name for the preset you export. If you leave it empty, the preset gets a name with the date.
- Example
- Breakdance + Woo base.
Export .json
- What it does
- Downloads your entire Spark configuration as a preset, so you can reuse a well-tuned site for the next client. Settings that belong to this site or this server deliberately do not come along, such as the object cache, Apache static serving and Varnish.
- How to check the effect
- Your browser downloads a file named spark-speed-preset followed by the domain name and the date.
- Watch out
- The file contains your exclusion lists and your domain name.
Choose file and ...or paste Claude's reply
- What it does
- Supply the preset or configuration as a file (smaller than 256 KB), or expand ...or paste Claude's reply and paste the text. Explanation around the JSON is fine; Spark cuts out the configuration block itself.
Merge
- What it does
- Your current settings stay. Only the settings in the file are overwritten, and lists are added to instead of replaced.
- When to switch it on or off
- The safe choice for most imports.
Replace
- What it does
- First resets everything to the defaults (except the settings that belong to this site and server) and then applies the file.
- When to switch it on or off
- When you want a site to match a preset exactly, or fully restore a previously exported state.
- Watch out
- Your own adjustments that are not in the file are lost.
Import
- What it does
- Reads the file or the pasted text and applies it according to your choice of Merge or Replace. The cache is then refreshed.
- How to check the effect
- The notice Preset imported, cache is being refreshed. If the import switches on risky settings, they are listed in the notice with a request to check the site.
- Watch out
- A file made for another site is refused, with the names of both sites. There is no automatic undo button.
- How to undo
- Export your current state first and, if anything goes wrong, import it with Replace.
Diagnostics report (.json)
- What it does
- The same download as Download diagnostic report at the top of this tab, with the AI instruction included.
- Requirements
- A valid licence.
Unsure about a step? Revert, check your site and ask us through the contact page.
No Spark Speed yet? See what it does and what it costs.
Frequently asked questions
That measurement comes from the diagnostic report. Download the report once on the Report tab; after that the check on the Overview can show a result.
Not in the admin screens of version 0.73.2. The decisions are in the diagnostic report (Report tab). In this version there is no undo button for an optimization run in the admin.
Google PageSpeed cannot reach a local site. Run Lighthouse in Chrome DevTools, save the report as JSON and use Upload Lighthouse JSON.
No. Spark measures the shortage and gives the php.ini lines you can copy, but you make the change yourself in php.ini or through your hosting provider. Until then frugal mode can relieve the server.
It contains no passwords or keys, but it does contain file paths, plugins with versions, your Spark settings and addresses of your site. Only share it with people you trust.