The Overview screen, the header bar and the WordPress toolbar
The Overview is the first screen you see when you open Spark Speed. This reference explains, card by card, what every button does and what every status means, including the header bar shown on every Spark Speed screen and the Spark button in the WordPress toolbar. It is written for WordPress administrators without developer experience; the screenshots come from a test site with Breakdance and WooCommerce.
In short
- Clear cache, Empty cache completely and Rebuild cache do the same thing: empty and rebuild right away
- Everything is working well! and System health sum up the health checks; the details are under Diagnostics
- Optimize my site tests riskier improvements in the browser first; keep the screen open until the round finishes
- In 0.73.2 the decisions of a round are in the diagnostic report, not on screen, and there is no undo button
The header bar
Every Spark Speed screen has the same header: the name with the version number (on the test site v0.73.2), and on the right the Clear cache button with a dropdown, two status pills and Help. The other screens also show Warm cache. You need the version number when you contact support.
Clear cache
- What it does
- Empties the whole page cache, the stored ready-made HTML copies of your pages, and then immediately puts all pages back in the queue to rebuild them, the most important ones first (such as the home page). This replaces outdated copies in one click.
- When to use it
- After a design change, a new theme or a plugin update whose result does not show on the site yet.
- Requirements
- An administrator account. The rebuild runs in the background and needs a working background runner (see System health).
- How to check the effect
- The notice Spark Speed: Cache cleared, rebuild started appears at the top. The counters in Cache build drop and then climb again, and the Spark button in the WordPress toolbar shows how many pages are still to go.
- Example
- You changed your header colours in your page builder: click Clear cache and visitors get the new version within a few minutes.
- Watch out
- Until a page has been rebuilt, WordPress generates it fresh on every visit, which is slower than a cached copy. The object cache (stored database results) is not emptied by this button.
- How to undo
- Cannot be undone and does not need to be: the cache rebuilds itself.
Arrow next to Clear cache
- What it does
- Opens a small menu with three extra choices: Empty cache completely, Rebuild cache and Temporarily disable all caching. Click again to close the menu.
Empty cache completely
- What it does
- Does the same as the Clear cache button: all page copies removed and rebuilt right away. So this menu has no option to only empty without rebuilding.
- How to check the effect
- Notice Spark Speed: Cache cleared, rebuild started.
- How to undo
- Cannot be undone; the cache rebuilds itself.
Rebuild cache
- What it does
- Empties the page cache and puts all pages back in the queue. The effect equals Clear cache; only the notice differs, because it tells you how many pages are being rebuilt.
- Example
- After importing a hundred new products you want to see how many pages go into the queue.
- Watch out
- In 0.73.2 the notice starts with the Dutch words Cache geleegd even in the English interface.
- How to undo
- Cannot be undone; the cache rebuilds itself.
Temporarily disable all caching
- What it does
- A link, not a direct action. It takes you to the Emergency stop card under Settings. There, Disable all caching plus a confirmation switches off all caching and optimisation for visitors.
- When to use it
- When you suspect a problem on the live site comes from caching or optimisation and you want to rule that out quickly.
- Watch out
- With the emergency stop on, visitors get uncached, unoptimised pages and your site is slower.
- How to undo
- Switch everything back on in the same Emergency stop card.
Active
- What it does
- Green Active pill when Spark Speed is really serving copies from the page cache to visitors right now. Otherwise it reads Inactive, for example while no licence has been activated.
- How to check the effect
- Open a page in a private window: it should load quickly and completely. Also look at the cache notice right below the tabs: it says how Spark serves, on the test site straight from disk, before PHP.
- Watch out
- The pill only says the cache is serving, not whether the background build is healthy. You see that in Cache build and System health.
License active
- What it does
- Shows the state of your licence and opens the licence page when clicked. On the test site: License active. When the licence enters its grace period or expires, the text changes to License expiring or License expired.
- Requirements
- Management and new optimizations need a valid licence, or the 14-day grace period.
- Watch out
- Without a valid licence every Spark Speed menu item opens the licence screen. An existing cache keeps working for visitors.
Help
- What it does
- Opens the knowledge base on sparkcore.io in a new tab.
Warm cache
- What it does
- Puts all pages of your site in the queue to cache them in advance, without emptying the existing cache first. That way even the first visitor of a page gets a fast copy right away.
- When to use it
- After adding many new pages or products.
- Requirements
- Not shown on Overview, but on Cache, Optimization, Diagnostics and Settings. On Overview you use Rebuild cache in the Cache build card.
- How to check the effect
- The queued counter goes up and the Spark button in the WordPress toolbar shows how many pages are still to go.
- How to undo
- Not needed: the queue empties by itself and the existing cache stays.
Overview, Cache, Optimization, Diagnostics, Settings
- What it does
- The tabs below the header. The same list appears in the WordPress menu under Spark Speed. The active tab is highlighted.
Cache notice and health banner
Right below the tabs are two wide cards. The first tells you whether Spark is really serving your cache, the second sums up at a glance whether everything works.
Spark Speed is serving your cache
- What it does
- Green confirmation with an explanation below it. On the test site (Apache): Spark serves cached HTML straight from disk, before PHP. If something is wrong with the cache, it becomes an orange card Cache heeft aandacht nodig with the reason, for example that another cache plugin still manages the page cache.
- Watch out
- In a few rare states this card holds a repair button, for example when a deactivated other cache plugin left a file behind. Read the explanation in the card first. In 0.73.2 the orange title stays Dutch even in the English interface.
Everything is working well!
- What it does
- Summary of all health checks. Green Everything is working well! means no problems were found. Orange There are issues means at least one warning; red There is a problem means at least one critical problem. The details are in the Issues card and under Diagnostics.
- How to check the effect
- On the right, Last check shows a date and time. That is the moment you loaded the page: the checks are recalculated on every load.
- Watch out
- Orange can also appear with 0 issue(s) found. In that case one of the core checks could not be determined yet; check Diagnostics to see which one.
Download report
- What it does
- Downloads the diagnostic report: a file with details about the server, cache, measured scores and this site's settings, for support or to hand to an AI assistant. According to the Diagnostics screen it contains no passwords or keys.
- When to use it
- When you contact support, or when you want to read which decisions Optimize my site made.
- Requirements
- A valid licence or the grace period.
- Watch out
- The report contains details about your site. Only share it with people you trust. The same button also sits in System health.
Core cards: Page cache, Object cache and Optimization
Three small cards with the state of the three main techniques. A coloured dot next to the title shows the health: green is good, orange needs attention, red is a problem, grey means off or not measured yet.
Page cache
- What it does
- Shows whether the page cache is on (Active or Off) and how many pages are ready. On the test site: 29 / 32 pages ready, with a progress bar.
- Watch out
- The word Active only follows the setting. If there is a conflict, it can still say Active with an orange or red dot, so also watch the dot and the cache notice above.
- Technical name
cache_enabled
Object cache
- What it does
- An object cache keeps frequently used database results in fast storage, so WordPress has to ask the database less often. The card shows which storage is in use (for example Redis active, or on the test site Sqlite) or Off, and below it how long data is kept (TTL: 1 day(s)) or, with Redis, the memory use.
- Requirements
- A storage on your server that Spark can use, such as Redis, Memcached, APCu or SQLite. On the test site Optimize my site switched on the SQLite storage itself after a check.
Optimization
- What it does
- Shows whether optimisation of CSS, JavaScript, fonts and media is on (Active or Off) and which profile Spark recognised. On the test site: Profile: breakdance, woocommerce. The profile comes from the plugins and page builder Spark finds on your site.
- How to undo
- You switch optimisation on or off with the main switch on the Optimization tab.
- Technical name
optimize_enabled
Cache build
Spark puts your site's pages in the cache in the background. This card shows how far that has got and whether the build keeps going.
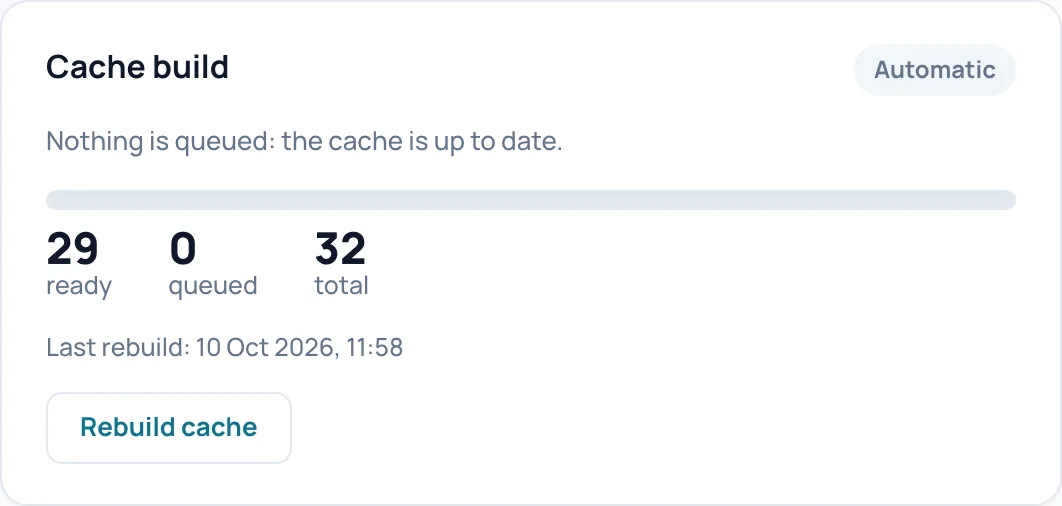
Automatic, ready, queued, total
- What it does
- The Automatic pill is green while pages are being built and grey when there is nothing to do. The sentence below says the same in words, for example Nothing is queued: the cache is up to date. The three counters: ready (pages in the cache), queued (still to build) and total (estimated number of pages on your site). Last rebuild is when the last build round finished.
- Watch out
- If the build stops, a warning line with the reason appears between the counters, such as Blocked by the site. On the test site that happened because the site could not reach itself.
Resume warmer
- What it does
- Only appears next to such a warning line. Spark makes a real test request to your site. If the site answers correctly, the build continues right away; if not, it stays paused and the notice says why.
- When to use it
- After you fixed the cause, for example switched off maintenance mode or solved a server problem.
- How to check the effect
- On the test site, after the fix, Spark answered: Warmer resumed: the site answered correctly. 32 pages still queued. 0 registered failures.
- Watch out
- Every failed test lengthens the pause until the next automatic attempt. So do not keep clicking while the cause is still there.
Rebuild cache
- What it does
- Empties the whole page cache and puts all pages back in the queue. The same as Clear cache in the header.
- How to check the effect
- A notice with the number of pages being rebuilt; the queued counter goes up.
- Watch out
- Until a page has been rebuilt, its visitors get a slower, freshly generated version.
- How to undo
- Cannot be undone; the cache rebuilds itself.
Process now
- What it does
- Only appears while pages are queued. Immediately processes a small part of the queue (at most 8 pages or 20 seconds), without waiting for the background. After that the background simply continues.
- When to use it
- When the background build is slow and you want to see whether building itself works.
- How to check the effect
- Notice Queue processed (continues in the background) and the ready counter goes up.
Performance
This card shows the latest Lighthouse or PageSpeed scores for mobile and desktop, with four core figures. Until something has been measured, you only see an explanation.
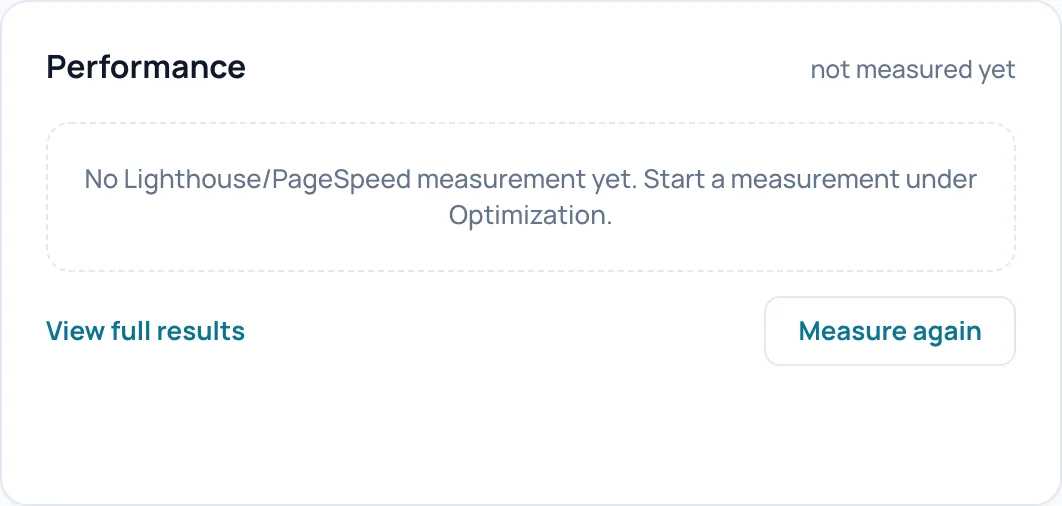
Scores and metrics
- What it does
- After a measurement: a score from 0 to 100 for Mobile and Desktop (green from 90, orange from 50 to 89, red below 50) and the values LCP (how fast the largest visible element appears), CLS (how much the layout shifts), INP (how fast the page responds to a click) and FCP (when the first content appears). The top right shows how long ago it was measured. Without a measurement it reads not measured yet and No Lighthouse/PageSpeed measurement yet. Start a measurement under Optimization.
- Watch out
- In 0.73.2 the time label (for example 7m geleden) stays Dutch even in the English interface.
View full results
- What it does
- Opens Diagnostics, Optimization section, with the detailed measurement results.
Measure again
- What it does
- Starts a new PageSpeed measurement for mobile and desktop of your site as it is now. The results appear in this card by themselves.
- When to use it
- After a change whose effect on the score you want to see.
- Requirements
- A valid licence, a PageSpeed API key under Settings, Measurement settings, and a site that is publicly reachable on the internet. PageSpeed cannot reach a local test site.
- How to check the effect
- Notice Measurement started (mobile + desktop). The results will appear here automatically. or, if something is missing, a notice that says what.
- Watch out
- Every measurement uses quota of your PageSpeed API key.
Latest activity
A short list of what recently happened to the cache, newest first.
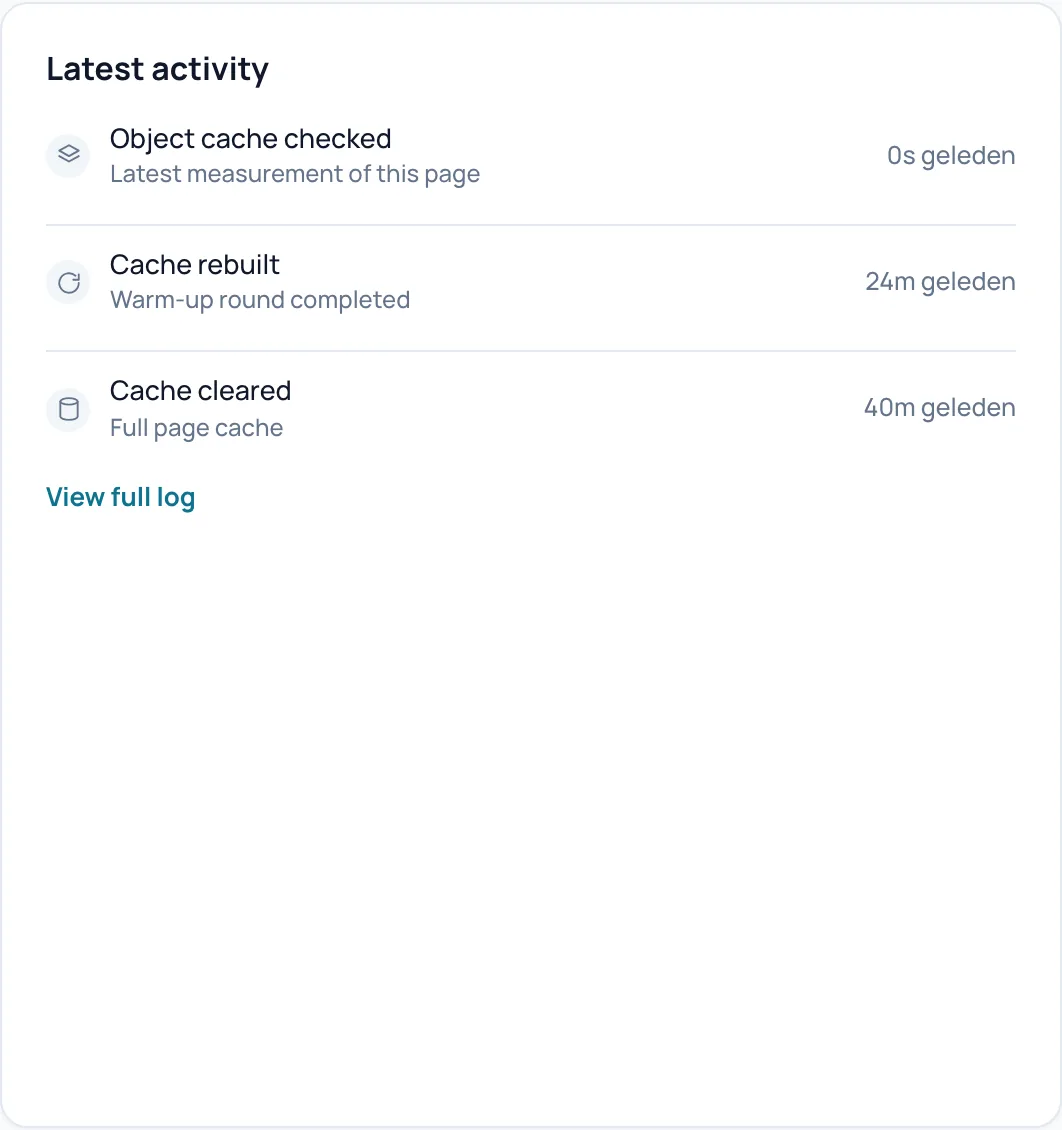
Activity lines
- What it does
- At most five lines with a time label, such as Cache cleared (the whole page cache was emptied), Cache rebuilt (a warm-up round finished) and Optimization run.
- Watch out
- The top line Object cache checked with 0s geleden is always there: it is the moment you loaded this page, not a separate check of the object cache.
View full log
- What it does
- Opens Diagnostics, Log section.
System health
Nine lines with the technical state of your cache and server, plus a summary pill at the top right. A quick first check without going to Diagnostics.
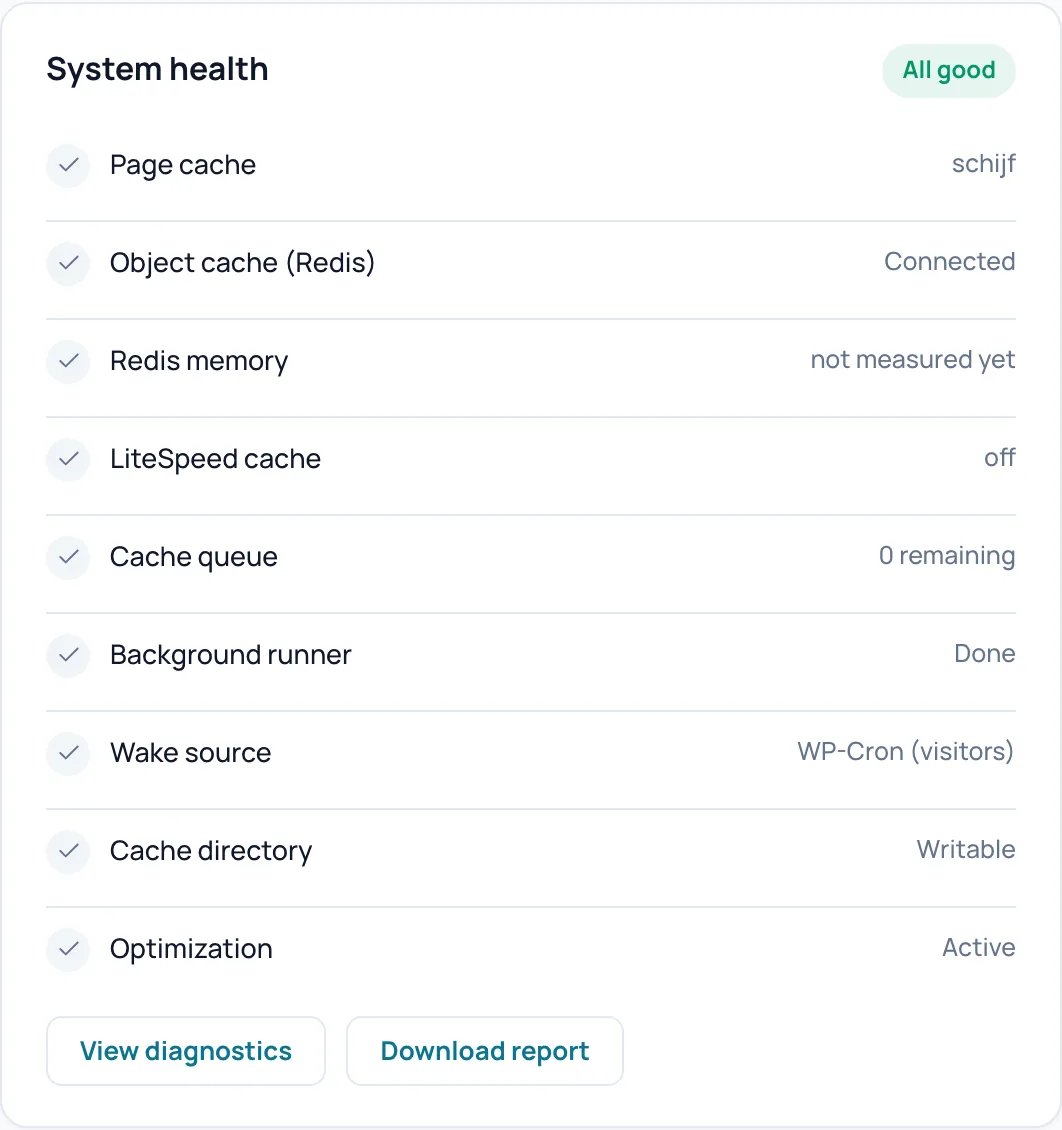
All good and the nine lines
- What it does
- The pill reads All good, Issues or Critical. Each line has a tick or exclamation mark and a value: Page cache (how the cache serves, on the test site schijf, meaning disk), Object cache (Redis) (connected or not), Redis memory, LiteSpeed cache (only relevant on a LiteSpeed server), Cache queue (pages in the queue), Background runner (the process that builds pages in the background), Wake source (what sets that process to work, for example WP-Cron (visitors)), Cache directory (can Spark write to the cache folder) and Optimization.
- Watch out
- Some values are internal codes and are not translated, such as schijf, off or, for the wake source, ketting (Spark's own chain of background requests). The Object cache (Redis) line also covers other storage: on the test site with SQLite it read Connected.
View diagnostics
- What it does
- Opens the Diagnostics tab with all checks, explanations and advice.
Download report
- What it does
- Same button as in the health banner: downloads the diagnostic report.
- Requirements
- A valid licence or the grace period.
Smart optimization
One button that measures your site, applies safe improvements, checks riskier improvements in a browser first and records every decision.
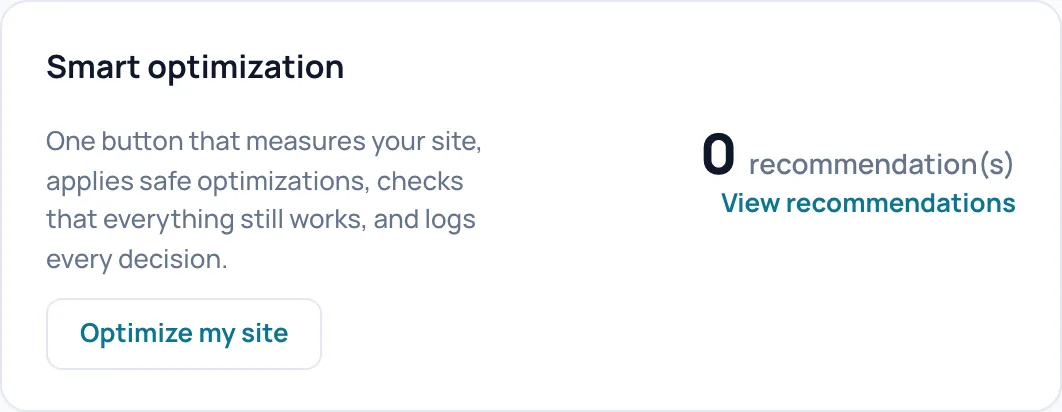
Optimize my site
- What it does
- Starts an optimization round. Spark first records the current settings and scores, then applies safe improvements directly (on the test site including deferring JavaScript, dropping unused WordPress parts and switching on the object cache after a check) and then tests each riskier improvement separately. In that browser check Spark loads a fixed set of real pages (on the test site home, shop, a product, my account, a blog post and a search page, among others) on mobile and desktop, with and without the change. It compares new errors in the browser console, missing or moved elements, and whether menu, slider, cart, forms, filters, popups and cookie banner still work. Only what makes nothing worse is applied.
- When to use it
- On a new site, or again after a major plugin or theme update.
- Requirements
- A valid licence or the grace period. Keep the admin screen open in your browser while the round runs: the browser check runs invisibly inside that screen.
- How to check the effect
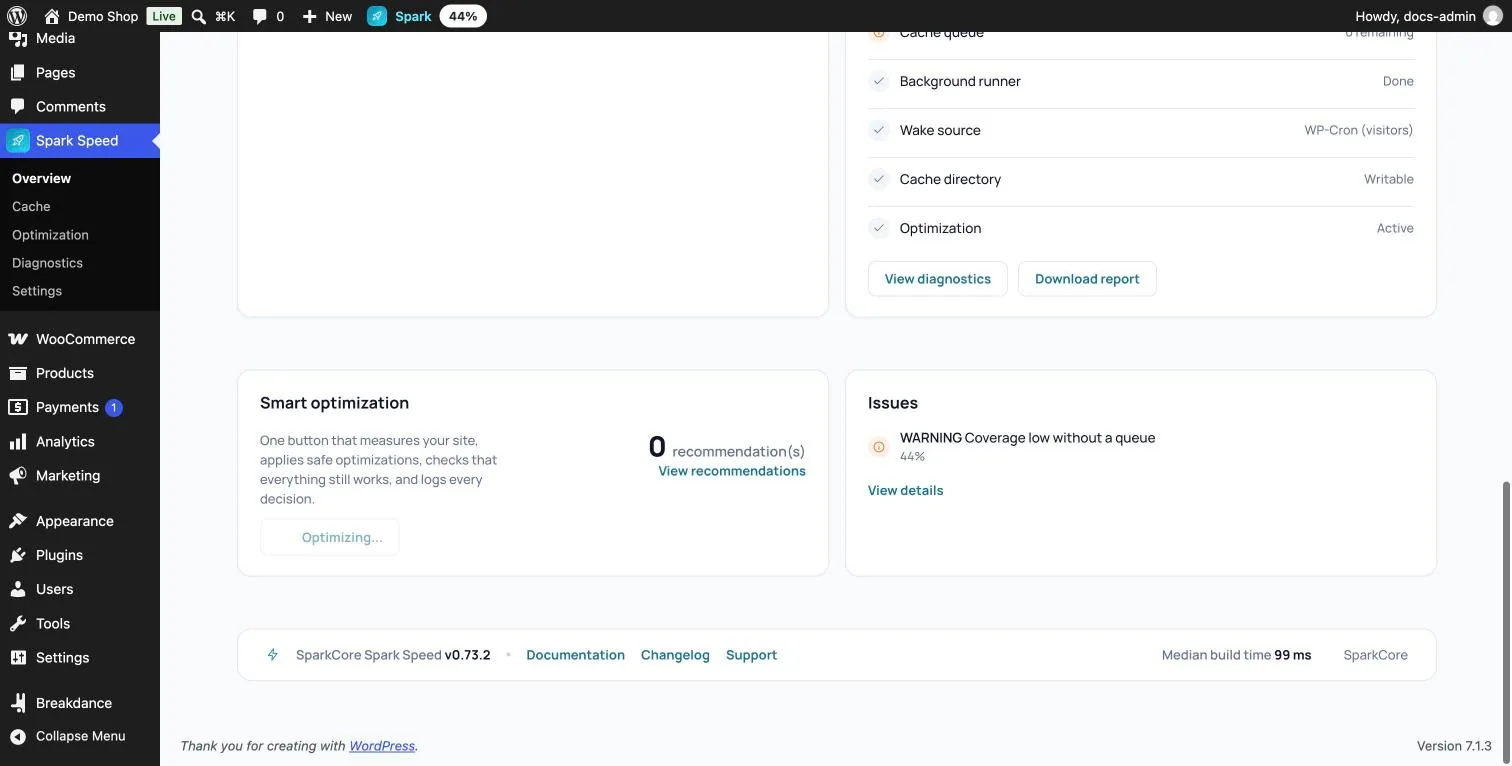
- The button turns grey with Optimizing.... There is no progress bar or step list. When done, the screen reloads and the button is ready again. The decisions per improvement (applied, skipped or rejected, with the reason) are not shown on screen; you read them in the diagnostic report via Download report.
- Example
- On the test site (Breakdance and WooCommerce) the first round took about twenty minutes. Eleven riskier improvements passed the check; delaying inline scripts was rejected because it caused new console errors on the home page.
- Watch out
- The round changes real settings and then rebuilds the cache. The browser check tests a fixed set of pages, not every page of your site: check your most important pages yourself afterwards. An action item about WebP conversion in the report points to a setting Spark Speed 0.73.2 does not have; image conversion is handled by Spark Media Optimizer.
- How to undo
- In 0.73.2 there is no button to undo a whole round. Switch off an improvement you do not want yourself on the Optimization tab, or use the Emergency stop under Settings to switch off all caching and optimisation at once.
recommendation(s)
- What it does
- The number comes from the latest proposal of the AI optimization on the Optimization tab, not from Optimize my site. Without an AI proposal it reads 0, even after a successful round.
View recommendations
- What it does
- Opens the AI section of the Optimization tab.
Issues
The checks that currently give a warning or a critical problem, so you see what needs attention.

Issues list
- What it does
- At most six lines, each with the label ACTION (critical, red) or WARNING (orange), the name of the check and the measured value. When everything is fine it reads No issues.
- Example
- During the first build on the test site this card showed WARNING Coverage low without a queue with 44%: less than 90% of pages were cached while the queue was already empty. Earlier, Queue without a wake source and OPcache limit possibly too low appeared, among others.
- Watch out
- The explanation and advice per check are only on Diagnostics.
View details
- What it does
- Only appears when there are issues and opens the Diagnostics tab.
Footer
At the bottom of every Spark Speed screen you find the version, three links and the typical build time.
Documentation, Changelog, Support
- What it does
- Open the knowledge base, the list of changes per version and the contact form on sparkcore.io in a new tab.
Median build time
- What it does
- How long building one page typically takes (the middle value of the measured pages), on the test site 123 ms. A high value means your site is heavy to build and visitors without a cached copy wait longer. Only appears after a measurement.
The Spark button in the WordPress toolbar
The black bar at the top of WordPress holds the Spark button, both in the admin and on your site itself. You see it as an administrator while that bar is visible. Hover it for the menu, click it for the Overview.
Spark
- What it does
- Shows the cache progress. While building: a bar and the number of pages still to go (tooltip Caching, N to go). Afterwards the percentage of your site that is cached, on the test site 91%. Shortly after finishing, the bar briefly turns green.
- Requirements
- An administrator account and a valid licence or the grace period. Without a licence the button does not appear.
- Watch out
- On your site itself the numbers are fixed at the moment you loaded the page; reload for new numbers. On narrow screens you only see the icon.
pagina's gecached · in wachtrij
- What it does
- First line of the menu: how many pages are cached and how many are still queued.
- Watch out
- This line is shown in Dutch in 0.73.2, even in the English interface.
Alles legen & opnieuw opbouwen
- What it does
- Empties the whole page cache and puts all pages back in the queue, just like Clear cache in the header. You stay on the page you were on. The object cache and the optimisation files are kept.
- When to use it
- You change something and want to refresh the cache without going to the admin first.
- How to check the effect
- No notice appears; after a reload the Spark button shows how many pages are still to go.
- Watch out
- In 0.73.2 this label is shown in Dutch even in the English interface.
- How to undo
- Cannot be undone; the cache rebuilds itself.
This page: cached
- What it does
- Only on your site itself. Says whether the page you are viewing has a copy in the cache: This page: cached or This page: not cached.
- Watch out
- As a logged-in administrator you usually do not get the cached copy. The label is about the copy for visitors, not about what you see now.
Clear cache for this page
- What it does
- Only on your site itself. Removes the cached copy of just this page and puts it back in the queue right away. You stay on the same page.
- Example
- You edited one product page: refresh just that page instead of the whole cache.
- How to undo
- Not needed; the page goes back into the cache by itself.
Diagnostics
- What it does
- Opens the Diagnostics tab.
Objectcache legen
- What it does
- Only visible when an object cache is active. Empties the object cache, so WordPress fetches stored database results again. The page cache stays.
- When to use it
- After a change made directly in the database, outside WordPress (the tooltip says: Needed after a direct database change).
- Watch out
- Afterwards the site is briefly slower until the object cache fills up again. In 0.73.2 this label is shown in Dutch even in the English interface.
Open dashboard
- What it does
- Opens the Spark Speed Overview.
Unsure about a step? Revert, check your site and ask us through the contact page.
No Spark Speed yet? See what it does and what it costs.
Frequently asked questions
In 0.73.2 none: both empty the whole page cache and put all pages back in the queue right away. Only the notice differs. Warm cache on the other screens fills the cache without emptying it first.
Not on screen: 0.73.2 shows no result card or log of the round. Click Download report; the diagnostic report lists for each improvement whether it was applied, skipped or rejected, with the reason. The switched-on features also show on the Optimization tab.
That line shows the moment you loaded the Overview. It is not a separate check. Whether the object cache is really connected you see in System health and in the Object cache core card.
A measurement needs a valid licence, a PageSpeed API key under Settings and a publicly reachable site. PageSpeed cannot reach a local test site; the notice after the click says what is missing.
It only appears for administrators, only when the WordPress toolbar is visible (set in your profile) and only with a valid licence or during the grace period.